Graph of a function
In this article we explain what is the graph of a function, what are its elements, what is the purpose of an analysis and the graphs of common functions.
Table of Contents
What is a graph?
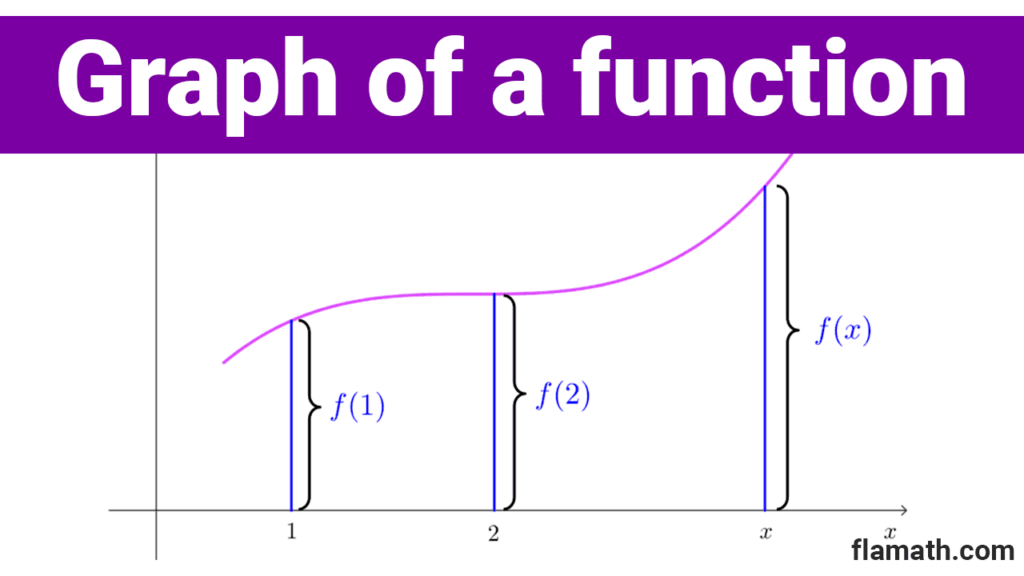
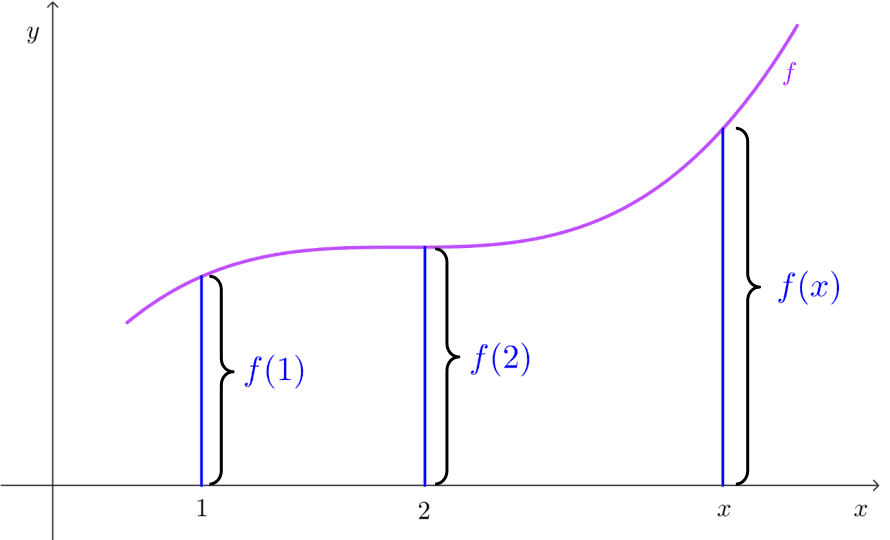
The graph of a function is the set of points in the Cartesian plane where the first coordinate is a value from the domain and the second coordinate is its corresponding image. In other words, the graph of a function f is a set of points (x, y) where x is in the domain of the function and also y=f(x). Symbolically:
*G_f=\{(x,y)~|~x∈D_f~~\text{and}~~y=f(x)\}*
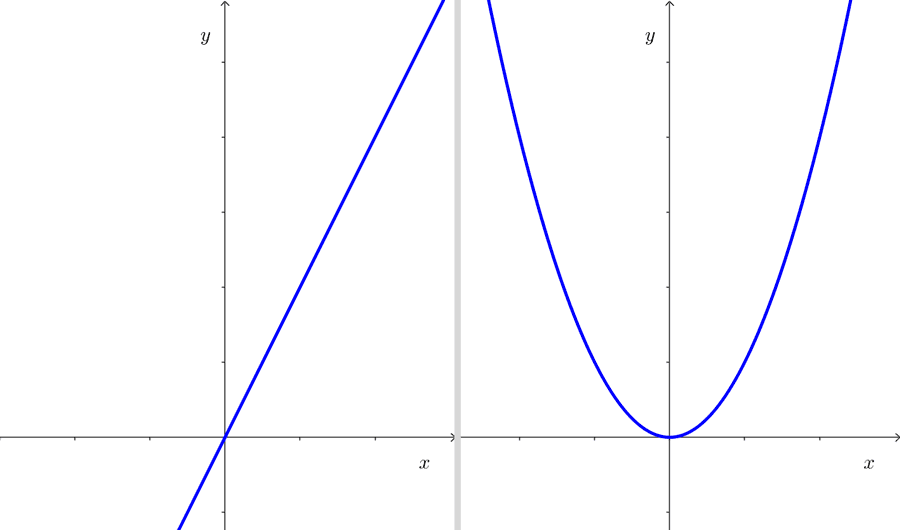
For example, the graph of the function *y=2x+1* is the set of all points in the Cartesian plane *(x, y)* where *y=2x+1* and *x* is in the domain of the function. The domain is considered along the horizontal axis (x-axis or abscissa) and the range along the vertical axis (y-axis or ordinate).
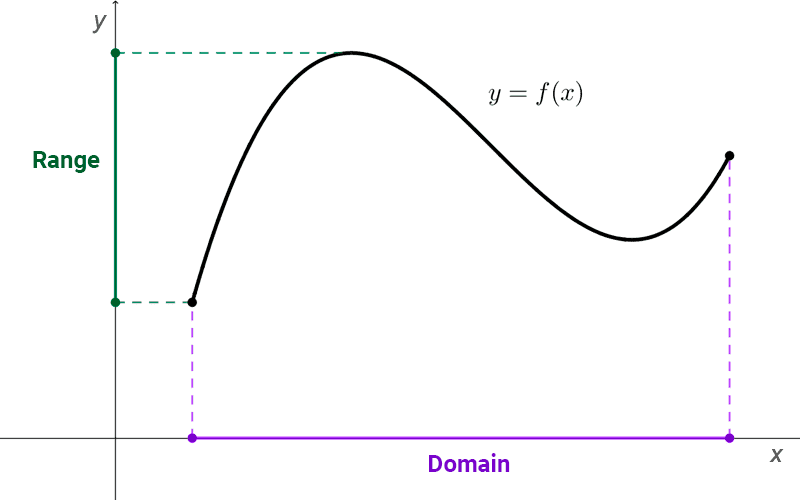
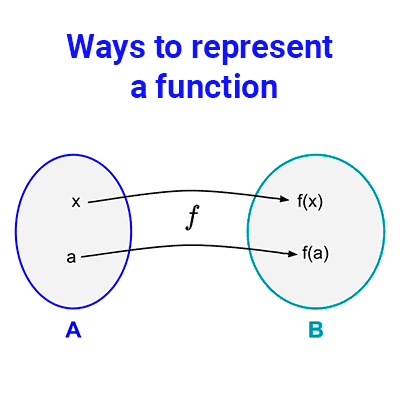
The graph is one of the ways to represent a function visually, allowing for an understanding of the function's behavior. If (x, y) is a point on the graph, then y=f(x) is the height of the graph at point x. This can be positive, negative, or zero, depending on the sign of f(x). Additionally, the domain and range can be obtained by reflecting the graph over the Cartesian axes.
The shape of the graph can vary depending on the nature of the function. For instance, a linear function will produce a straight line on the Cartesian plane (as in the first example), whereas a quadratic function will generate a curve called a parabola. Other functions produce different curves.
In most real functions, it's not possible to represent all points (x, y) because they are infinite. To plot graphs, it's common to represent some significant points and draw the rest of the graph taking into account the properties of the function.
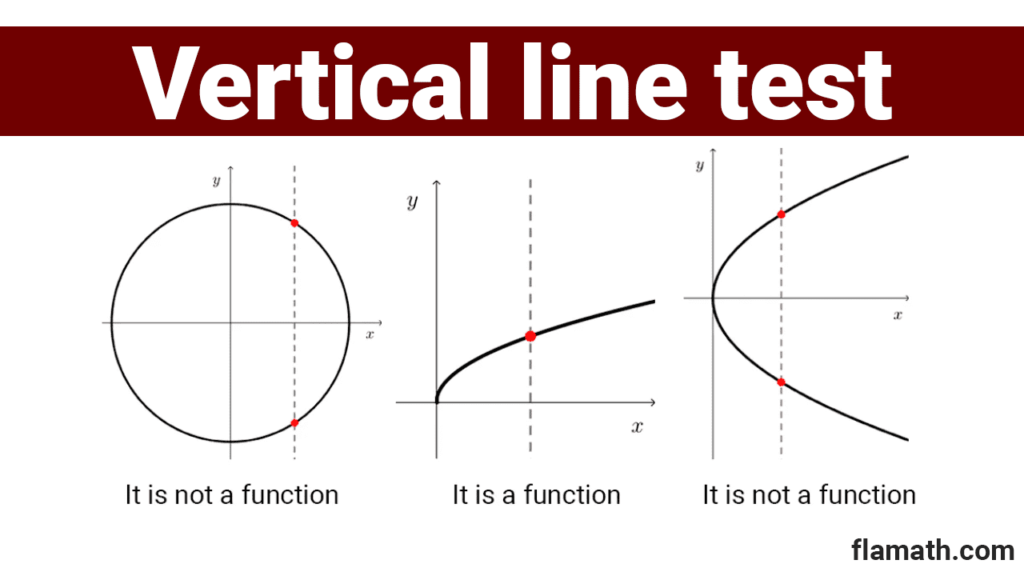
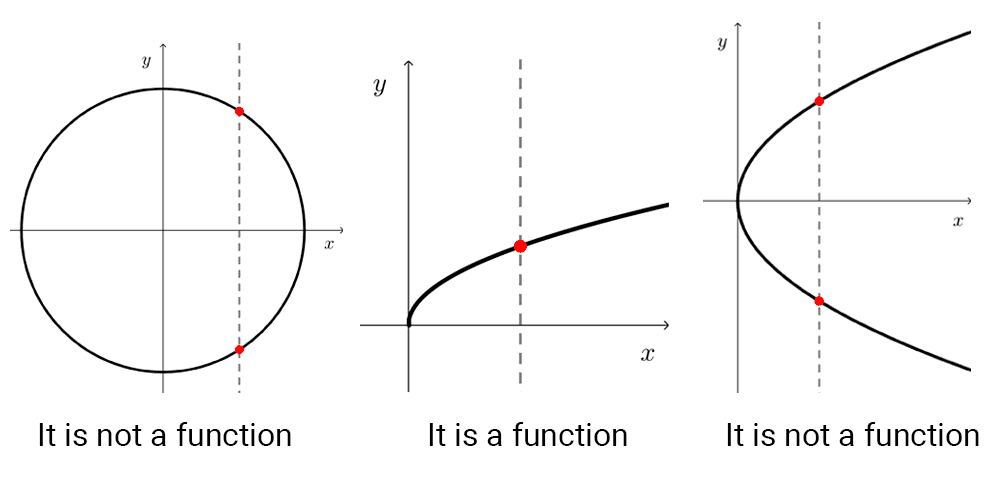
Not all lines on a Cartesian plane can correspond to a function. The graphs of functions have the property that a vertical line can intersect them at most once, because otherwise it means that the same number has more than one image, not fulfilling the definition of a function.
This observation provides an appropriate visual criterion for differentiating the graph of a function from other curves. It is usually called the vertical line test, and it tells us that a line on the plane is the graph of a function if and only if no vertical line intersects it more than once.
Elements of the graph
We can highlight the following elements of a graph:
- Cartesian axes: the horizontal axis (x-axis) where the domain of the function is located and the vertical axis (y-axis) where the range is located. The point where the axes intersect is called the origin of coordinates.
- Points: each point on the graph is an ordered pair *(x, y)* where *y=f(x).* The value of x is called the abscissa of the point and the value of y is called the ordinate.
- Curve: most functions describe a curve, which passes through all the points of the function.
- Intersections with the axes: the graph of a function can intersect both the x-axis, when *y=0,* or the y-axis, when *x=0.* The intersections with the x-axis are called zeros or roots and can be infinite. In turn, the intersection with the y-axis, if it exists, is unique.
Analysis of graphs
Important characteristics of a function can be identified through the analysis of its graph. Some of the properties that can be found include:
- Function sign: a function can have intervals where it is positive and others where it is negative. If the graph is above the x-axis, the function is positive. If the graph is below the x-axis, the function is negative. If at a point the graph intersects the x-axis, this point is a zero or root, and it can change the sign of the function if it crosses the axis.
- Symmetry: some functions can be symmetric with respect to the y-axis, these are called even functions; or they can be symmetric with respect to the origin, and are called odd functions.
- Increasing and decreasing intervals: these are intervals in which the function is increasing or decreasing, respectively. They can be identified by observing the direction of the function's curve in those intervals.
- Maximums and minimums: these are the highest (maximums) and lowest (minimums) points on the graph of a function. They can be relative or absolute, depending on whether they are the highest or lowest points in a specific interval or in the entire domain of the function.
- Asymptotic behaviors: some functions may tend to approach lines as the independent variable approaches certain values. These lines are called asymptotes and can be horizontal, vertical, or oblique. Asymptotic behavior is common in rational functions, although there are more functions that have them.
- Function concavity: refers to the orientation of the function's graph in a given interval. It can be concave upwards (U-shaped) or concave downwards (∩-shaped).
- Inflection points: these are the points where the concavity of the function's curve changes. At these points, the function can change from being concave upwards to concave downwards, or vice versa.
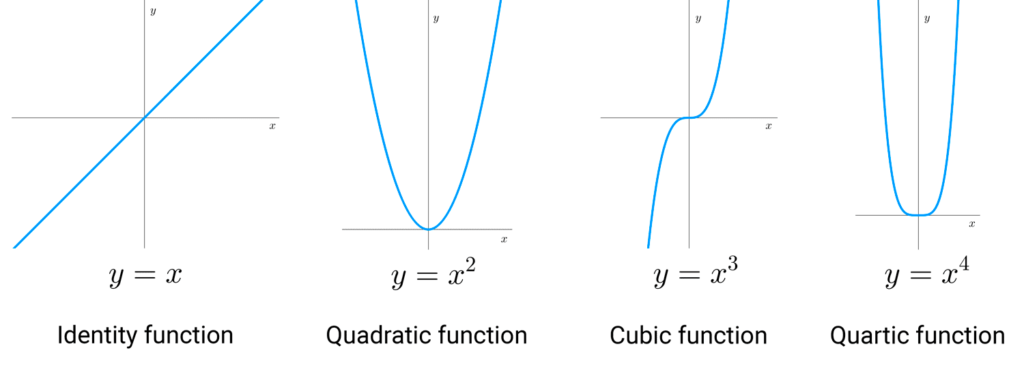
Graphs of elementary functions
The following images show the graphs of common functions that are important to know.
FAQs
What is the graph of a function used for?
The graph of a function is used to visualize and understand the behavior of the function. It provides a visual representation of how input values relate to output values, which helps to understand patterns, trends, critical points, asymptotic behavior and other characteristics.
What important elements can be identified in the graph of a function?
From the graph of a function it is possible to identify the points of intersection with the axes, maxima and minima, intervals of growth and decay, concavity, symmetry, asymptotic behavior, among other things.
How do you determine the domain and range of a function from its graph?
The domain and range can be determined by projecting the graph of the function on the x-axis and y-axis, respectively. With this, the ranges of values reached by the independent variable and the dependent variable can be identified.





Other articles that may interest you