Analyzing quadratic functions
An analysis of quadratic functions involves studying and understanding the properties, behavior, and characteristics of second-degree functions. The analysis typically includes the following elements:
- Graph: The graph of a quadratic function is a parabola. Analyzing the graph provides information about the intersection points of the parabola with the axes, the vertex of the parabola, and the concavity of the parabola.
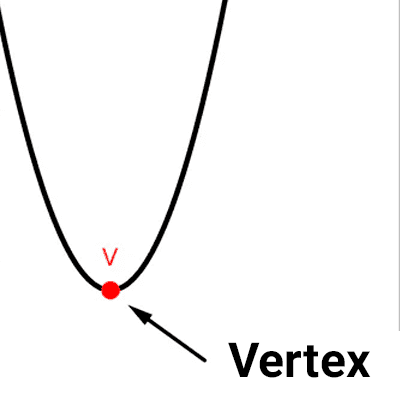
- Vertex: The vertex of a quadratic function is the highest or lowest point of the parabola, depending on the case.
- Axis of Symmetry: The axis of symmetry of a quadratic function is the line that passes through the vertex of the parabola and divides it into two equal parts.
- Domain and Range: The domain of a quadratic function is the set of all values of x for which the function is defined. The range of a quadratic function is the set of all values of f(x) for which x is in the domain of the function.
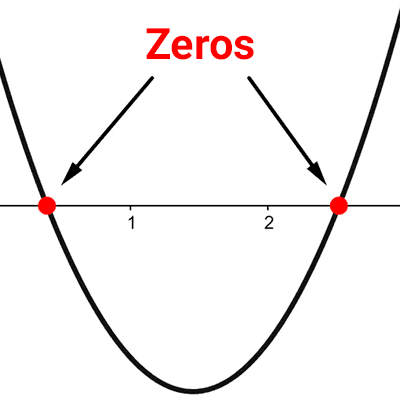
- Zeros or Roots: The zeros or roots of a quadratic function are the values of x that make the function equal to zero.
- Intervals of Positivity and Negativity: The intervals of positivity and negativity of a quadratic function are the intervals of x for which f(x) is positive or negative, respectively.
- Intervals of Growth and Decay: The intervals of growth and decay of a quadratic function are the intervals of x for which f(x) is increasing or decreasing, respectively.
Below, you can see how to find each of these elements step by step:


